Quick Start Guide#
This Quick Start guide provides an overview of DPM Tools and highlights some of its main functionality.
Objectives#
The primary objectives of this project is to provide users with a unified interface for processing, analyzing, and visualizing digital porous media images. We aim to complement other existing software tools that are commonly used in the digital porous media community, such as PoreSpy, scikit-image, and PyVista.
Further, our intent is for these tools to be used with the Digital Porous Media Portal (DPMP, formerly Digital Rocks Portal), an excellent source of data! The Portal has undergone significant redesign, and part of the transition includes integration of these tools in dedicated virtual machines and on high-performance computing resources with direct access to Portal data. We invite you to check out the DPMP Documentation for more details.
Prerequisites#
Most of the tools available in this library are designed to work with 2D and 3D Numpy arrays. We have also implemented an Image dataclass that contains additional information to streamline integration with the Digital Porous Media Portal. This dataclass is also used for the 3D visualization module.
Quick Start Guide#
import dpm_tools as dpm
import numpy as np
import matplotlib.pyplot as plt
import skimage
[16:25:23] ERROR    PARDISO solver not installed, run `pip install pypardiso`. Otherwise,          _workspace.py:56
                    simulations will be slow. Apple M chips not supported.
Reading Images#
As part of our io module, we currently have a wrapper function to read 2D and 3D images from various file formats that are present on DPMP. However, most functions can be used with any 2D or 3D Numpy array.
path = "../data/berea_pore.tif"

berea_pore = dpm.io.read_image(path)

fig, ax = plt.subplots(figsize=[5, 5])
img = ax.imshow(berea_pore[50], cmap="gray")
Segmentation#
The DPM Tools segmentation module currently includes two segmentation algorithms: Statistical Region Merging (SRM) and Seeded Region Growing (SRG).
These algorithms are implemented in Fiji/ImageJ, but to our knowledge, have not yet been widely distributed in Python.
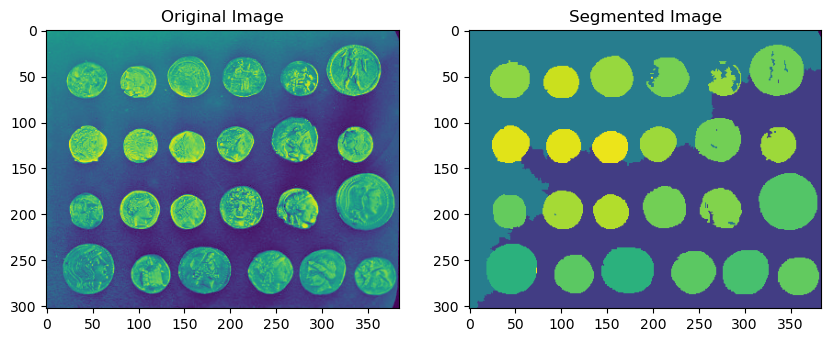
Statistical Region Merging#
coins_image = skimage.data.coins()
segmented = dpm.segmentation.statistical_region_merging(coins_image, Q=5.0)

# Plot the result
fig, ax = plt.subplots(1, 2, figsize=(10, 5))
ax[0].imshow(coins_image)#[0, :, :])
ax[0].set_title("Original Image")
ax[1].imshow(segmented)#[0, :, :])
ax[1].set_title("Segmented Image")
plt.show()
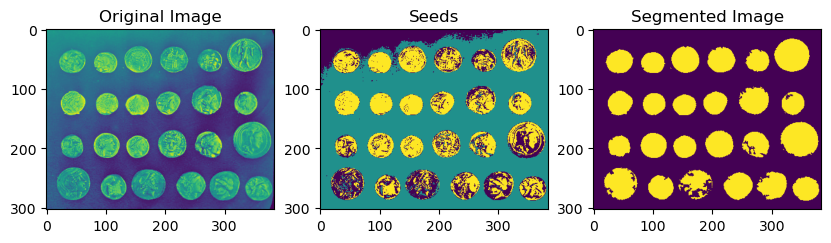
Seeded Region Growing#
from scipy.ndimage import binary_fill_holes
coins_image = skimage.data.coins()

# Seed labels start from 1. SRG fills in 0s
coin_seeds = (coins_image > 150).astype(np.uint8) * 2
background_seeds = (coins_image < 105).astype(np.uint8)
seeds = coin_seeds + background_seeds

segmented = dpm.segmentation.seeded_region_growing(coins_image, seeds, normalize=True)
# Subtract 1 to make the labels start from 0
segmented -= 1
segmented = binary_fill_holes(segmented)

# Plot the result
fig, ax = plt.subplots(1, 3, figsize=(10, 5))
ax[0].imshow(coins_image)
ax[0].set_title("Original Image")
ax[1].imshow(seeds)
ax[1].set_title("Seeds")
ax[2].imshow(segmented)
ax[2].set_title("Segmented Image")
plt.show()
Metrics#
The metrics module provides various functions for characterizing the geometry of a binarized tomogram. These include both scalar metrics such as the Minkowski functionals and local metrics such as the Euclidean distance transform.
Minkowski Functionals#
pore_phase = 0
berea_pore = berea_pore == pore_phase

mfs = dpm.metrics.minkowski_functionals(berea_pore)

print(f"Volume: {mfs[0]:.2f} cubic voxels")

print(f"Surface Area: {mfs[1]:.2f} square voxels")

print(f"Integral Mean Curvature: {mfs[2]:.2f} (voxels)")

print(f"Euler Characteristic: {mfs[3]:.2f}")
Volume: 236764.00 cubic voxels
Surface Area: 40608.00 square voxels
Integral Mean Curvature: 1824.22 (voxels)
Euler Characteristic: 0.00
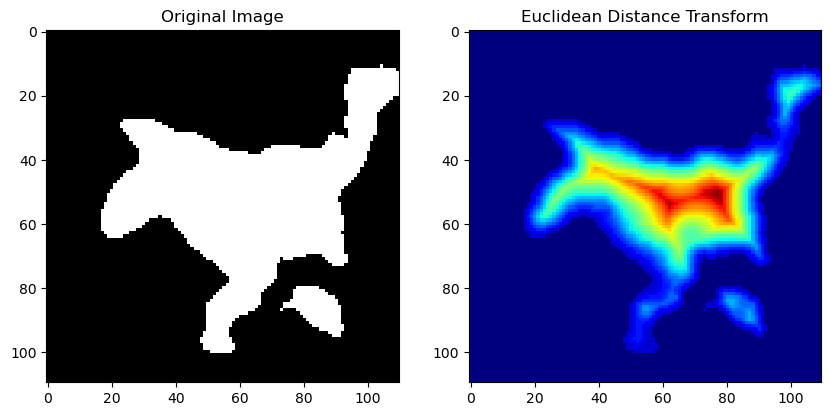
Euclidean Distance Transform#
eucl_distance_transform = dpm.metrics.edt(berea_pore)

fig, ax = plt.subplots(1, 2, figsize=(10, 5))

ax[0].imshow(berea_pore[50], cmap="gray")
ax[0].set_title("Original Image")

ax[1].imshow(eucl_distance_transform[50], cmap="jet")
ax[1].set_title("Euclidean Distance Transform")
Text(0.5, 1.0, 'Euclidean Distance Transform')
3D Visualization#
The DPM Tools visualization module contains wrapper functions for interactive 3D visualization using PyVista. These include visualizations of isosurfaces, streamlines, medial axes, and more!
Disclaimer:
Because the VTK wheels on PyPI and Anaconda do not have MPI enabled, parallelism is currently not supported. For larger images, we recommend using dedicated tools such as Paraview.
berea_image = dpm.io.Image(scalar=berea_pore)
import pyvista as pv
pv.set_jupyter_backend('static')
fig = dpm.visualization.plot_isosurface(berea_image, show_isosurface=[0.5])
fig.show()

Coming Soon:#
io#
We are currently in the process of standardizing image formats on DPMP. This will make it easier to obtain samples for simulation and build training datasets for machine learning applications. The current plan is to convert and store images in HDF5 format, with the ability for chunked and parallel IO.
Additional utilities will be added to help with converting to/from the DPMP HDF5 format.
fraclab#
We are also developing a new module called fraclab — set of tools to assist in identifying and characterizing fractures (e.g., aperture, orientation, roughness, etc.).
Follow us!#
Follow our LinkedIn profile to stay updated on news about the Digital Porous Media Portal and these tool!