Maximum Inscribed Spheres#
Compute the maximum inscribed spheres of the entire image. The underlying workhorse uses the local_thickness from PoreSpy.
Import packages#
import dpm_tools as dpm
import porespy as ps
import numpy as np
import matplotlib.pyplot as plt
[14:55:40] ERROR    PARDISO solver not installed, run `pip install pypardiso`. Otherwise,          _workspace.py:56
                    simulations will be slow. Apple M chips not supported.
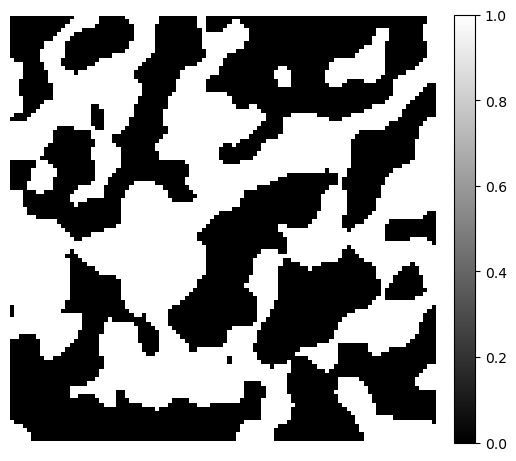
Demonstration image#
To demonstrate the maximum inscribed spheres, we generate a simple 3D binary image using the PoreSpy blobs generator function. The example image size is \(100 \times 100 \times 100\).
image = ps.generators.blobs(shape=[100, 100, 100])

fig, ax = plt.subplots(figsize=[6, 6])
im = ax.imshow(image[50], cmap="binary_r")
fig.colorbar(im, fraction=0.046, pad=0.04)
ax.axis(False)
(-0.5, 99.5, 99.5, -0.5)
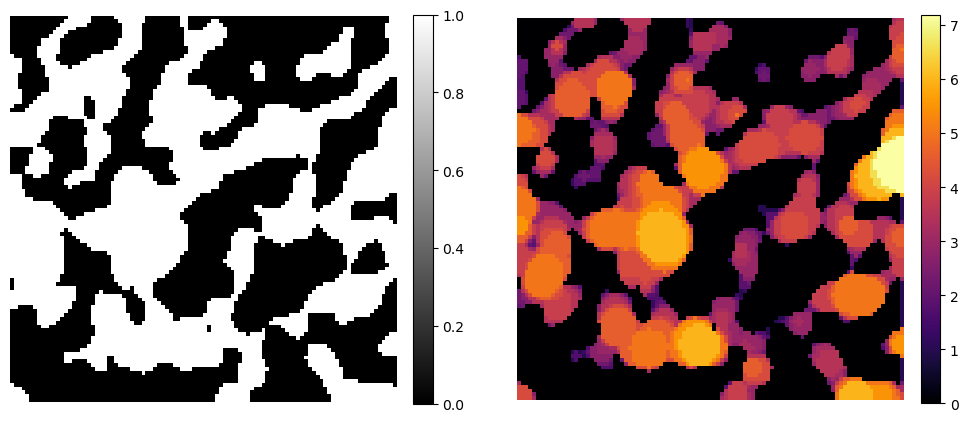
Maximum Inscribed Spheres#
Maximum inscribed spheres are the largest spheres that can fit entirely within a given shape or region, touching its boundary without crossing it. In image processing and porous media analysis, they are used to quantify local pore size, geometric accessibility, or distance to constrictions.
The mis function in the dpm_tools.metrics module expects a 2D or 3D np.ndarray where the phase of interest (foreground) is labeled as 1. The function accepts keyword arguments as porespy.filters.local_thickness().
image_mis = dpm.metrics.mis(image)

fig, ax = plt.subplots(1, 2, figsize=[12, 6])
im = ax[0].imshow(image[50], cmap="binary_r")
fig.colorbar(im, fraction=0.046, pad=0.04)
ax[0].axis(False)
im = ax[1].imshow(image_mis[50], cmap="inferno")
fig.colorbar(im, fraction=0.046, pad=0.04)
ax[1].axis(False)
(-0.5, 100.5, 99.5, -0.5)